PHP Basics: Finding PHP Errors in Joomla
Finding PHP Errors in Joomla
Sometimes, things don’t show up how you expect… or don’t show up at all. 😩 To figure out what’s wrong, we use tools like var_dump() and Joomla’s debug mode to peek under the hood.
Using var_dump() in PHP
What is var_dump()?
It tells you what’s inside a variable—the value and its type.
<?php
$price = 29.99;
var_dump($price);
?>
Output: float(29.99)
Useful for:
- Seeing if a variable is empty or missing
- Checking arrays and objects
- Understanding what your code is doing (or not doing)
Example in Joomla
<?php
$article = $this->item;
var_dump($article);
?>
This might show a huge blob of info (like an object), but that’s good—it shows you what’s available.
Using Joomla’s Debug Mode
Joomla has a built-in debug system that shows errors, SQL queries, and more.
Steps to turn it on:
- Log into Joomla Admin
- Go to System → Global Configuration
- Click the System tab
- Set Debug System to Yes
- (Optional but helpful) Set Error Reporting to Maximum under the Server tab
Now when you load a page, Joomla will show:
- PHP errors
- Undefined variables
- Helpful warnings at the bottom of the page
Common Mistakes
Using var_dump() outside of <?php ?>- Not turning on debug mode and wondering why nothing’s showing
- Ignoring error messages—they usually tell you exactly what’s wrong!
Always turn debug off on a live site—it can show sensitive data!
Real-World Debug Flow
<?php
$user = Factory::getUser();

if (!$user) {
    echo "User not found!";
} else {
    var_dump($user);
}
?>
That checks if $user is empty and then dumps the object if it exists.
Finding the issue with Debugger
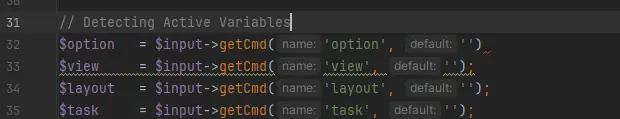
The deeper you get into your journey, you will encounter PHP errors. When these occur, it's important to know how to read the debugger to find out where the issue may be. In the image below, I have purposely removed a semi-colon from the end of the item in line 32.

In initial error message tells us there is a syntax error (ie: somebody screwed something up), but not much else. With the debugger enabled, we can now see the Call Stack at the bottom of the page. This is essentially a chronological order of the files used the moment the request to load the page came up to the point where something broke down. Many times, we can simply look at the top-most item to find the issue, but sometimes, the issue could be found in an earlier file that in most cases, was using older (deprecated) code that the top-most file in the list was calling on.
In this particular case, we can see the error is triggered on the index.php file found in the templates/mytemplate directory and the error is on line 33.
If I intentionally removed the ; from the end of line 32, why would it say the error is line 33?
Since we have already learned that ; closes the line, removing it leads the system to think line 32 is not finished and that line 33 is an extension of line 32. This then causes a syntax error as we can't have two = statements in the same line.
If I am starting off - how would I know the error is really line 32 (simply adding a ; to the end) when the Call Stack is telling me line 33?
That is a great question and is one of the many benefits to using a Joomla aligned IDE such as PHPStorm. Once I am able to open the errored page in PHPStorm, it will show me there is an error on line 32 as seen in the screenshot below. Hovering my mouse over that red squiggly at the end of line 32 will tell me I am missing a semicolon.